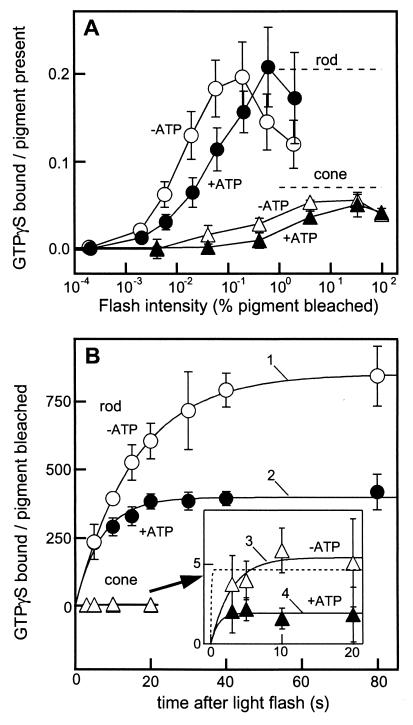
Figure 2.
Transducin activation in the rod and the cone membranes. (A) Transducin activation as a function of flash intensity, expressed as the number of GTPγS incorporated per visual pigment present. The GTPγS binding reaction in the rod membranes (○, ●, n = 3) was terminated 40 s after a light flash, and that in the cone membranes (▵, ▴, n = 3–4) was terminated at 20 s. The dashed lines show the maximum GTPγS binding in the rod (0.25 ± 0.03 GTPγS bound per pigment present) and the cone (0.071 ± 0.002 GTPγS bound per pigment present) membranes. The maximum activity in the rod membranes was determined 300 s after a light flash bleaching 0.19% of rhodopsin, and that in the cone membranes was determined 80 s after a flash bleaching 95% visual pigment. For unknown reasons, GTPγS binding in the rod membranes decreased as the flash intensity increased above 0.2% bleach. (B) Time courses of GTPγS binding in the rod (○, ●, n = 3) and the cone (▵, ▴, n = 3–6) membranes with (●, ▴) and without (○, ▵) ATP. GTPγS binding is expressed as the amount of GTPγS incorporated per visual pigment bleached. The light flash used for the rod membranes bleached 0.019% of rhodopsin and that for the cone membranes bleached 0.41% of cone visual pigments. The time course of GTPγS binding in the cone membranes is shown at an expanded scale (Inset). With curve fitting, we determined the turnover number of the transducin activation and the decay time constant of R* (curves 1–4; see text). To determine the light-induced activation, background activity was always subtracted in each measurement. The dotted line shows the fitting of an extreme case when the initial rate of GTPγS binding is the same as that in the rod membranes.

