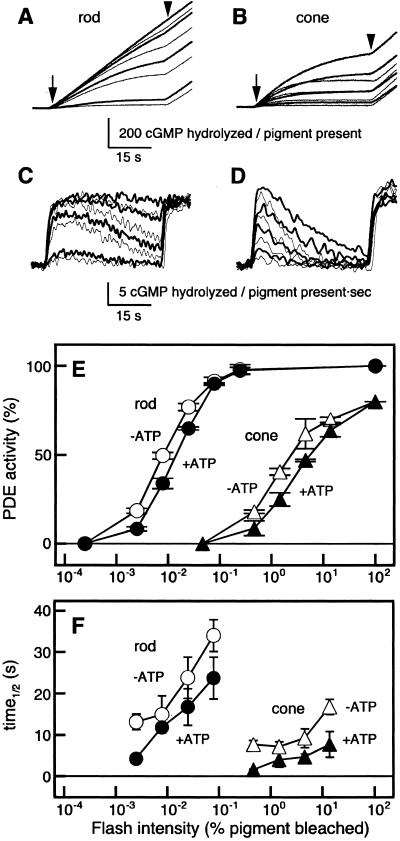
Figure 4.
PDE activation in the rod and the cone membranes. PDE activity was measured with the pH assay method. (A and B) The pH drop was monitored in either the rod (A) or the cone (B) membranes with (bold traces) or without (thin traces) ATP. An arrow indicates the timing of the test flash and an arrowhead the onset of a bright steady illumination. To measure the light-induced changes in PDE activity, dark PDE activity was always subtracted. (C and D) First derivatives determined from the data shown in A and B, respectively. (E) Peak PDE activities in the rod (○, ●, n = 3) and the cone (▵, ▴, n = 3) membranes as a function of test flash intensity. In each measurement, maximum PDE activity was measured, and the PDE peak activity as elicited by a test flash was expressed as a percentage of the maximum activity. In the rod membranes, the maximum PDE activity was 22.3 ± 3.1 cGMP hydrolyzed per pigment present per second (n = 3), and in the cone membranes it was 17.8 ± 1.5 cGMP hydrolyzed per pigment present per second (n = 3). To compare the rod and cone PDE activation directly, each PDE peak activity in the cone membranes is expressed so that the maximum cone PDE activity is 80%. (F) Half-life of activated PDE as a function of test flash intensity (n = 2–3). The PDE half-life was determined as the time required for the recovery of the PDE activity to 50% of the peak activity. Symbols are as used in E.

