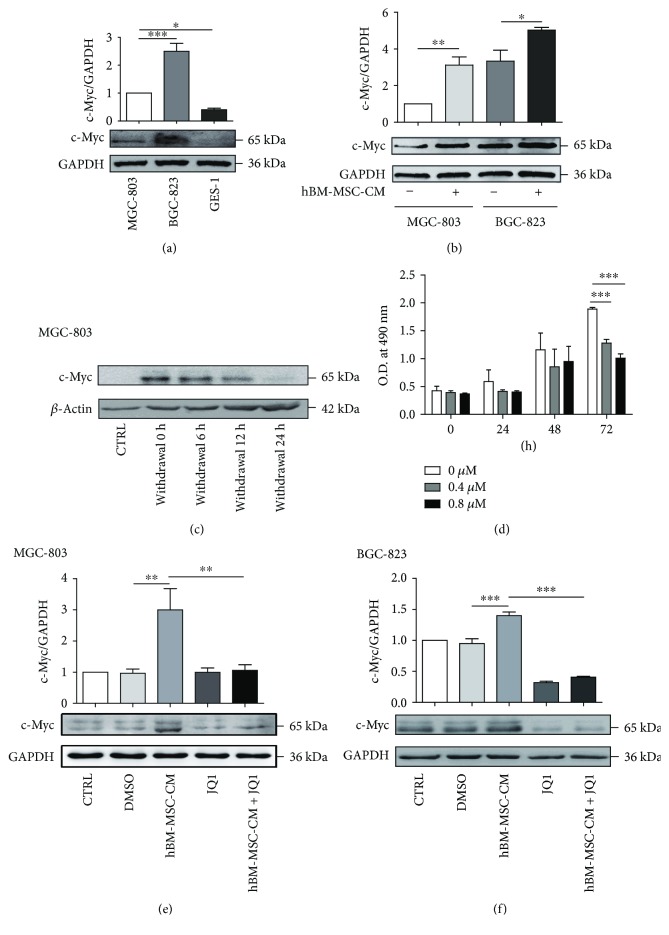
Figure 1.
hBM-MSC-CM increased c-Myc expression in gastric cancer cells. (a) c-Myc protein levels in MGC-803, BGC-823, and GES-1 were detected by Western blot analysis. ∗P < 0.05, ∗∗∗P < 0.001. (b) c-Myc levels after 48 h hBM-MSC-CM treatment. ∗P < 0.05, ∗∗P < 0.01 (c) c-Myc protein levels maintained after withdrawal of hBM-MSC-CM treatment were detected by Western blot analysis. (d) MGC-803 cells were treated with 0.4 and 0.8 μM JQ1 for 24, 48, and 72 h. ∗∗∗P < 0.001. (e, f) Compared with hBM-MSC-CM, hBM-MSC-CM + JQ1 decreased c-Myc expression in MGC-803 or BGC-823 cells. ∗∗P < 0.01, ∗∗∗P < 0.001.

