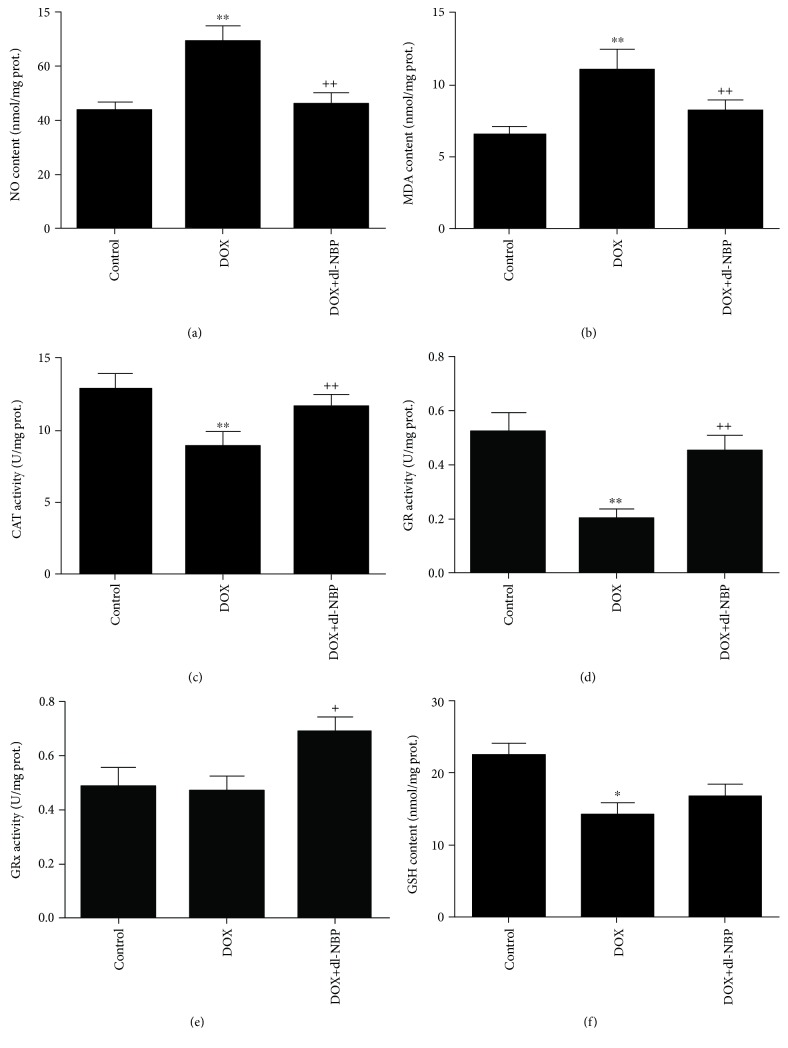
Figure 2.
Effects of DOX and dl-NBP on oxidative stress markers in the hippocampus: NO content (a), MDA content (b), CAT activity (c), GR activity (d), GPx activity (e), and GSH content (f). Data are expressed as means ± SEM (n = 8). ∗ p < 0.05 and ∗∗ p < 0.01 compared to the control group. + p < 0.05 and ++ p < 0.01 compared to the DOX-injected group.

