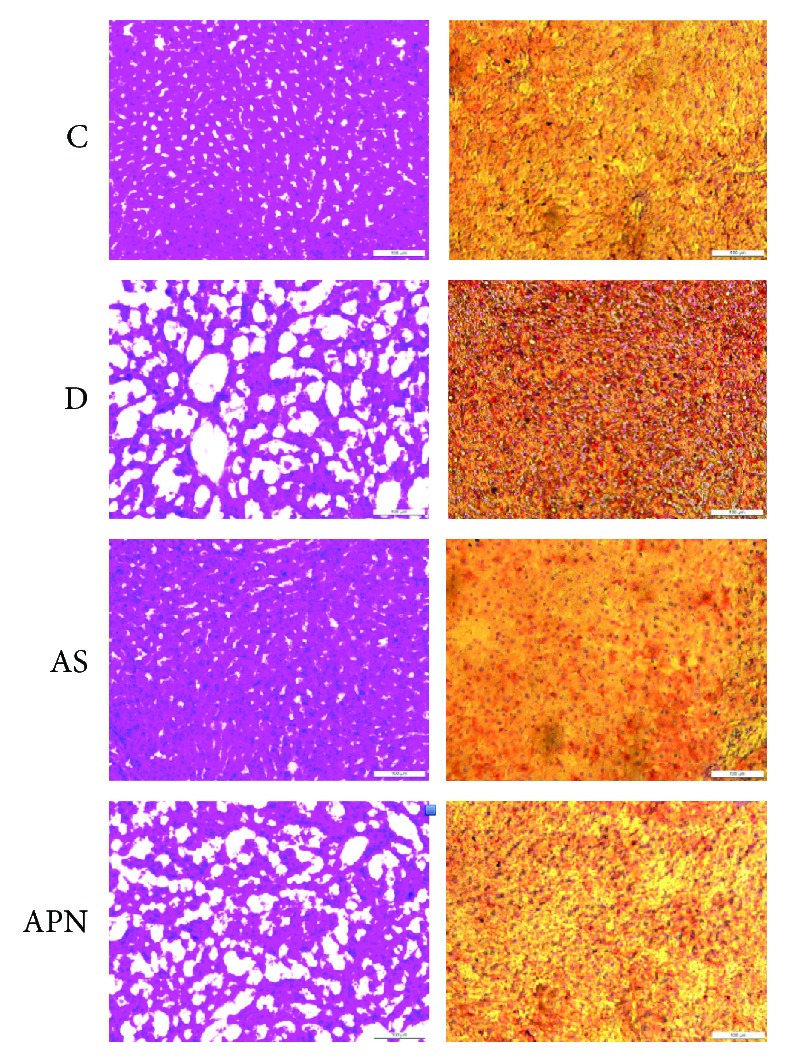
Figure 1.

Representative H&E (hematoxylin and eosin) and Oil Red O staining of liver structures in different groups of rats. Images of staining under a microscope (magnification, ×20). C: control group; D: diabetic group; AS: AS-treatment group; APN: APN-treatment group.
