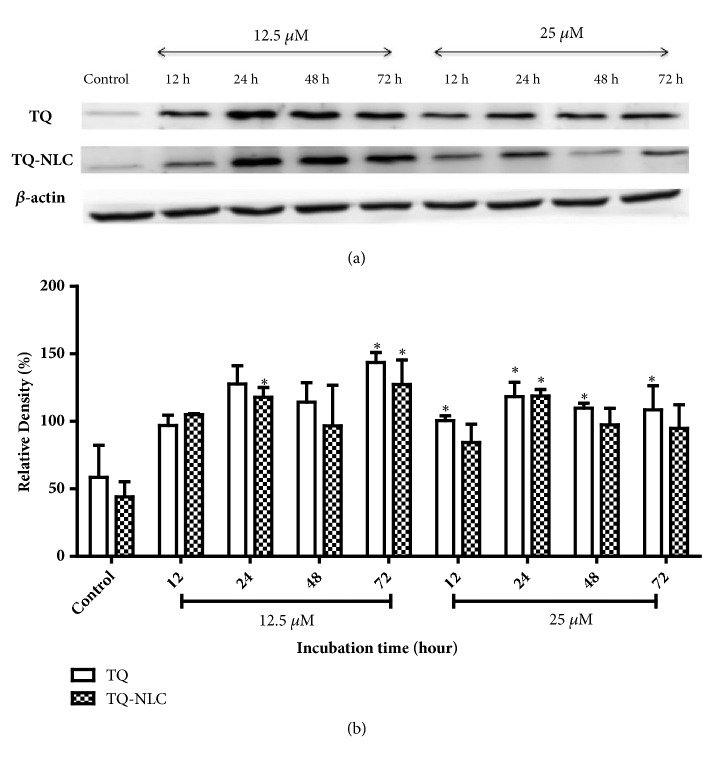
Figure 2.
Caspase-3 expression in Hep3B upon treatment with TQ or TQ-NLC. (a) Western blot analysis of caspase-3 protein expression after treatment with indicated concentrations of TQ or TQ-NLC for 12, 24, 48, and 72 hours. Whole cell protein lysates were analyzed via Western blotting using antibodies against caspase-3. (b) Protein level was quantified using the densitometry analysis of Image J and expressed as relative density percentage. Data are presented as mean ± SEM and represent three independent experiments. Statistically significant differences are indicated as ∗p<0.05. Note: ∗compared with the control.

