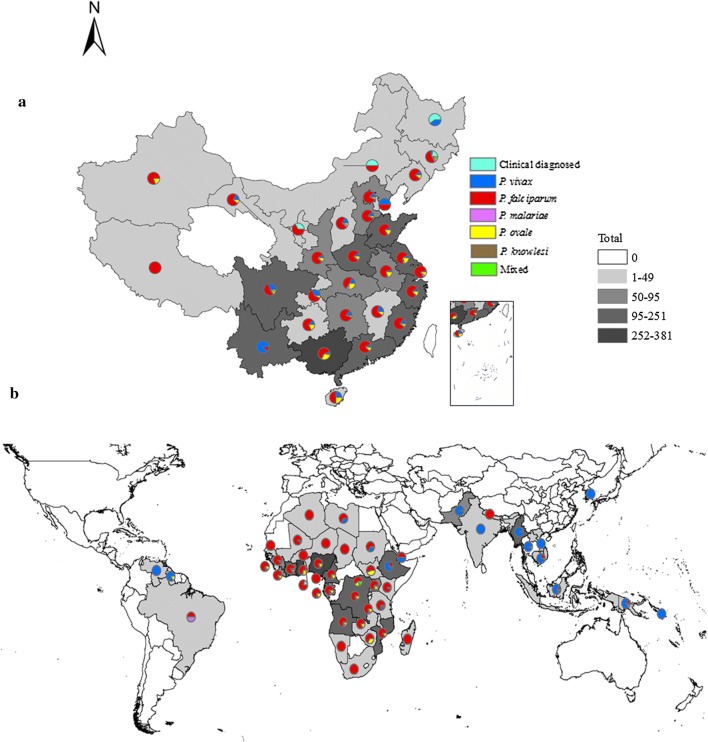
Fig. 3.
The distribution of imported cases in China stratified by species (a) and origin of those imported cases (b) in 2017. The number of malaria cases using different colours to represent the imported cases distribution in China, as well as the origin of those cases. Each province in China and the origin country was marked with different colours on the map

