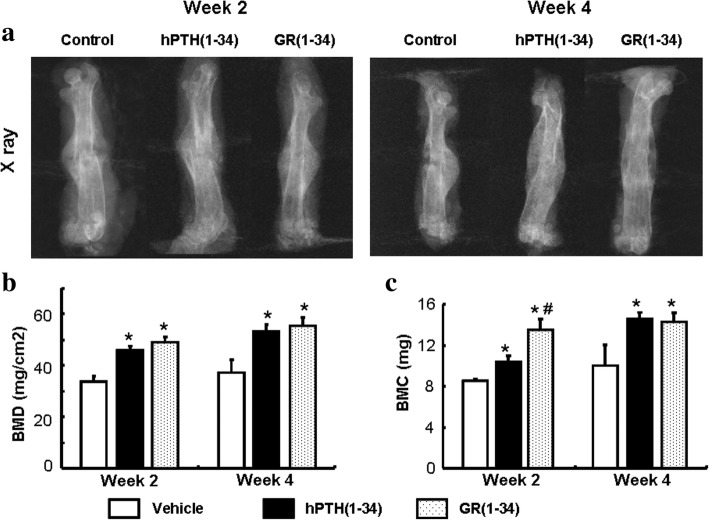
Fig. 2.
Bone mineral density and bone mass content in the fracture area measured with DEXA. a The plain X-ray images for femur alignment at the 2nd (left panel) and 4th week (right panel) after peptide injection. b The statistical analysis on BMD from DEXA. c The statistical analysis on bone volume [BV/TV (%)] from DEXA. [Each group contained 12 cases; *P < 0.05 for hPTH(1–34) &GR(1–34) vs. vehicle; #P < 0.05 for hPTH(1–34) vs. GR(1–34)]

