
Figure 3:
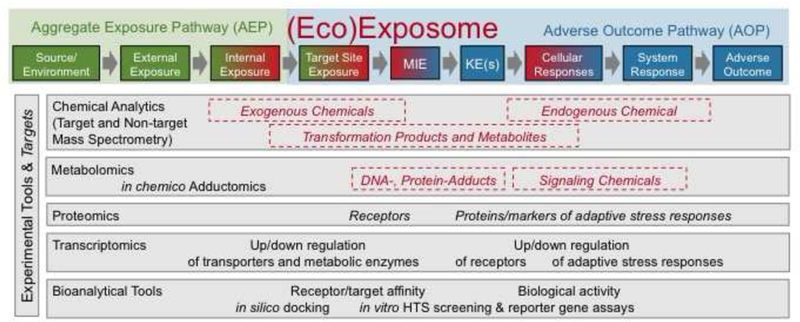
Interface between the (eco)exposome (in red), the aggregate exposure pathway (AEP, green) and adverse outcome pathway (AOP, blue). The red dashed boxes represent chemical components of the exposome. The AEP/AOP concept allows one to disentangle key events and allocate them to steps from the source of exposure to adverse effects. The grey boxes indicate experimental methods to quantify the chemical components of the exposome and the biological components of the AOP. Figure partially adapted from (Teeguarden et al. 2016).