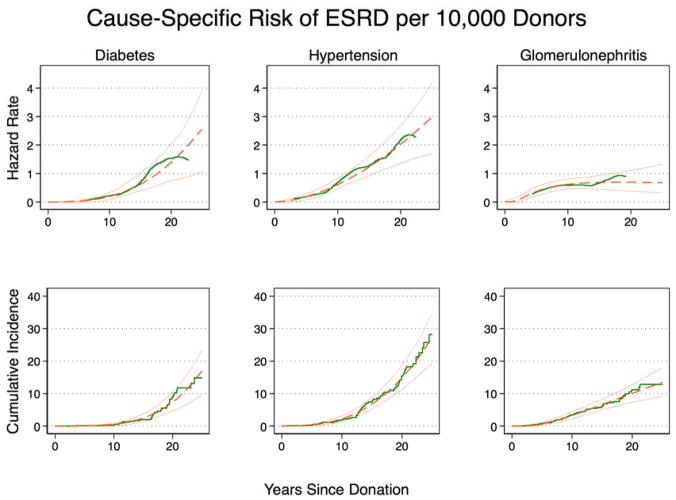
Figure 1. Hazard rate and cumulative incidence of cause-specific end stage renal disease (ESRD) in live kidney donors, United States, October 1, 1987 – July 31, 2014.
Kaplan-Meier (green, solid line) and generalized gamma model (GG) (orange, dashed line; 95% CI solid) illustrate, for diabetes: a low unadjusted hazard rate of ESRD <10 years postdonation (0.10.20.3 cases per 10,000 donors per year at 10 years) and a substantial increase in unadjusted hazard rate of ESRD 10–25 years postdonation (1.02.53.8 cases per 10,000 donors per year at 25 years); hypertension: a low unadjusted hazard rate of ESRD 0–10 years (0.50.60.8 cases per 10,000 donors per year) and a substantial increase in unadjusted hazard rate of ESRD 10–25 years (1.72.94.1 cases per 10,000 donors per year); and for glomerulonephritis (GN): a relatively constant unadjusted hazard rate of ESRD 0–25 years postdonation (0.50.610.8 per 10,000 donors per year at 10 years vs. 0.30.671.3 cases per 10,000 donors per year at 25 years. As per GG, the cumulative incidence of cause-specific ESRD at 25 years was 9.316.622.7, 19.026.833.7, and 9,113.417.7 per 10,000 donors for diabetes, hypertension, and GN (very closely approximating the Kaplan-Meier estimates)

