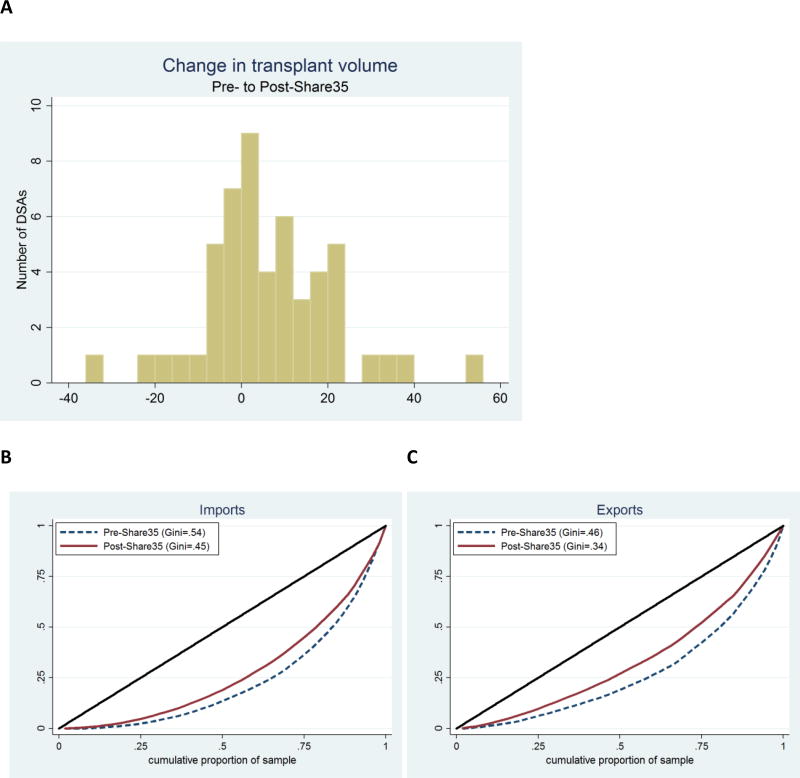
Figure 4. DSA-level change in transplant volume and imports/exports.
(A) Histogram of DSA change in transplant volume from pre-Share35 to post-Share35. Compared to the pre-share35 period, in the post-Share35 period 32 DSAs had increased volume, three DSAs had the same volume, and 17 DSAs had decreased volume. (B) Lorenz curves of imports by DSA pre-Share35 and post-Share35. The curve for the post-Share35 period is closer to the diagonal line, indicating broader sharing of liver imports. (C) Lorenz curves of exports by DSA pre-Share35 and post-Share35. Similar to imports, the curve for the post-Share35 period is closer to the diagonal line, indicating broader distribution of liver exports.

