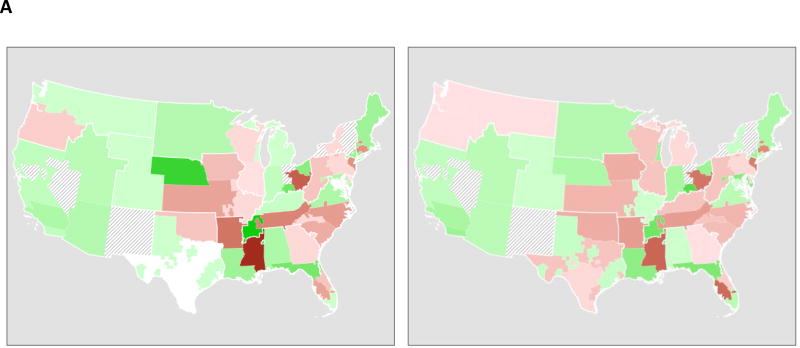
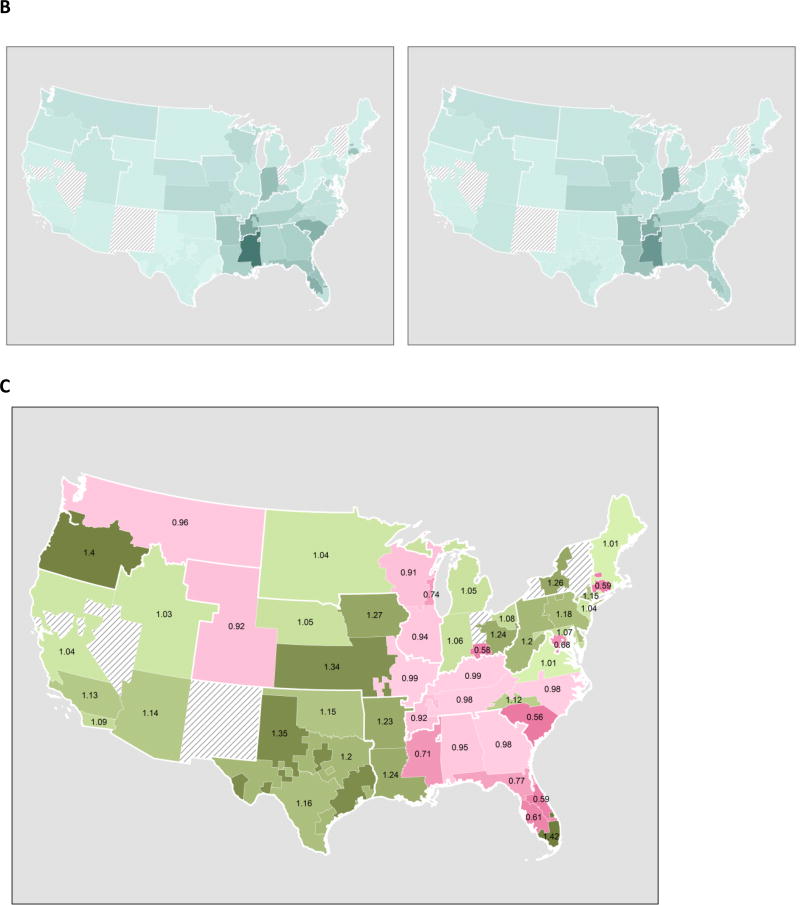
Figure 5. DSA-level changes associated with Share-35.
(A) Net import or export for each DSA, pre-Share35 (left) and post-Share35 (right); green indicates net import (more imports than exports), and brown indicates net export; a darker shade indicates greater magnitude. Hash marks indicate DSAs with no transplant centers performing liver transplantation. Region 8 (Wyoming, Colorado, Nebraska, Kansas, Iowa, and Missouri) and Region 9 (New York) had some regional sharing prior to the implementation of Share-35. Net import and export were largely unchanged with the implementation of Share-35.
(B) Transplant rate per DSA, pre-Share35 (left) and post-Share35 (right); a darker shade indicates higher rate of transplant. Rates increased in (C) Ratio of transplant rate pre-Share35 and post-Share35 for each DSA; green indicates a higher MELD-adjusted transplant rate post-Share35, and berry indicates a lower transplant rate post-Share35.


