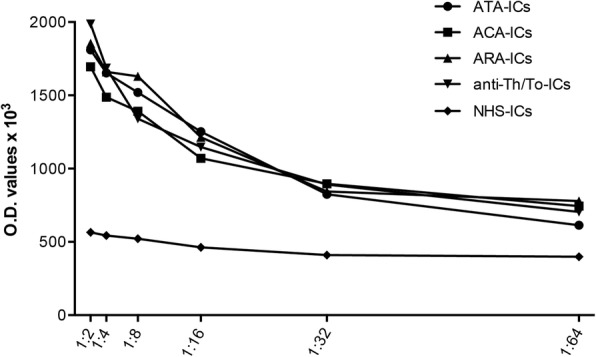
Fig. 2.

Dose–response dilution curve for ICAM-1 expression on fibroblast cell surface. Fibroblasts exposed to serial two-fold dilutions (from 1:2 to 1:64) of SSc-ICs and NHS-ICs, and ICAM-1 evaluated by cell ELISA. anti-Th/To anti-Th/To antibodies, ATA anti-DNA topoisomerase I antibodies, IC immune complex, NHS normal healthy subjects, OD optical density
