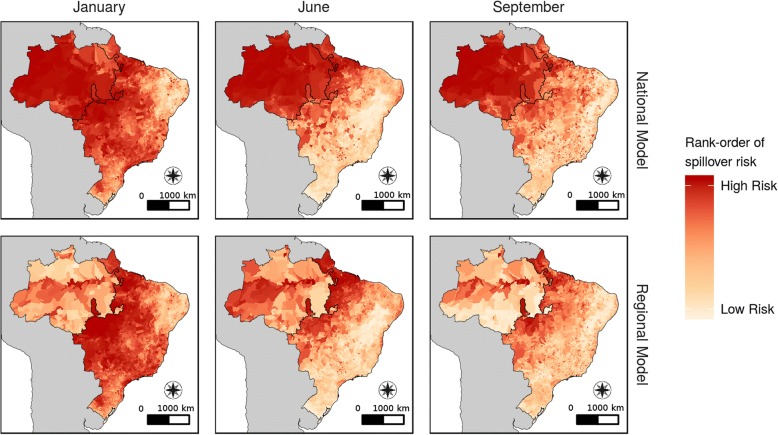
Fig. 3.
Predicted spatial risk of yellow fever spillover. Propensity of yellow fever spillover in January, June, and September of 2008. Raw outputs of the model for each municipality-month are rank-ordered to allow for comparison across models. Results from the National model are on the top row and the Regional model are on the bottom row. Black outline represents the split between HRR (northwest) and LRR (southeast) regions. The outline in the national model is for reference only. See supplemental video for entire time series. Map projection: SAD69 Brazil Polyconic. Data source: 2001 municipality boundaries, Brazilian Institute of Geography and Statistics

