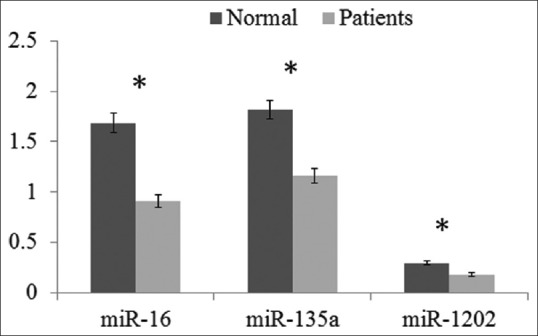
Figure 1.

Serum level of miR-16, miR-135a, and miR-1202 relative expression by quantitative real-time polymerase chain reaction of patients with depression (n = 39) compared to healthy control (n = 36). The data represent as the 2–ΔCt. Statistical analyses were done using Mann–Whitney test. *P < 0.001 is statistically significant
