
Figure 2.
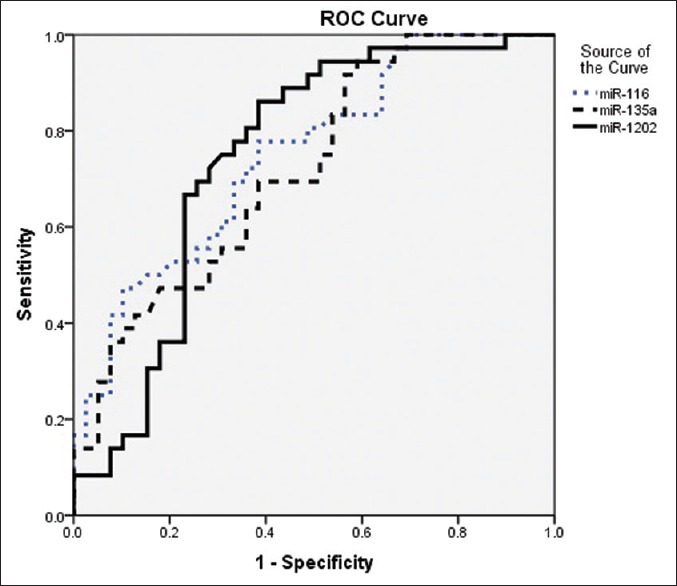
The combined receiver operating characteristic curve of the miR-16, miR-135a, and miR-1202. The plots were constructed using SPSS software. MiR-16 yields an area under the receiver operating characteristic curve of 0.75 (sensitivity of 77.8% with a specificity of 61.5%). MiR-135a also yields an area under the receiver operating characteristic curve of 0.72 (sensitivity of 94.4% with a specificity of 41.0%). MiR-1202 also yields an area under the receiver operating characteristic curve of 0.74 (sensitivity of 86.1% with a specificity of 61.5%)