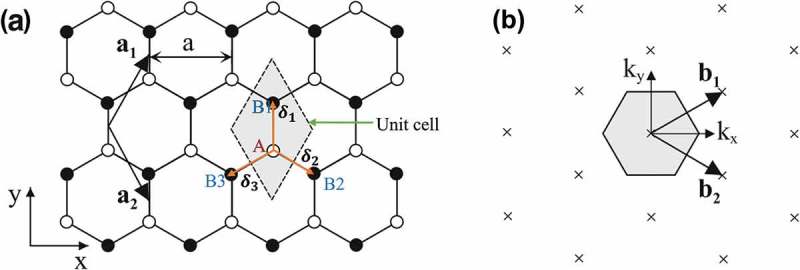
Figure 3.

(a) Honeycomb lattice of monolayer graphene, where white (black) circles indicate carbon atoms on A (B) sites, and (b) the reciprocal lattice of monolayer graphene, where the shaded hexagon is the corresponding Brillouin zone [51] (reused with permission from [51] Copyright © 2011, Springer-Verlag Berlin Heidelberg.).
