Figure 4.

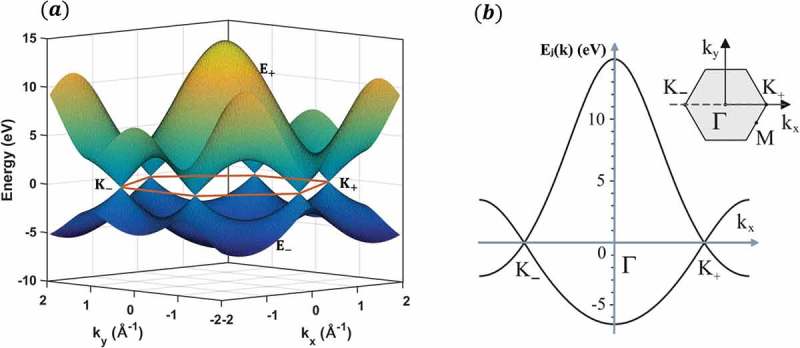
(a) Band structure of graphene calculated with a tight-binding method with , and . (b) Cross-section through the band structure, where the energy bands are plotted as a function of wave vector component along the line .

(a) Band structure of graphene calculated with a tight-binding method with , and . (b) Cross-section through the band structure, where the energy bands are plotted as a function of wave vector component along the line .