Figure 17.

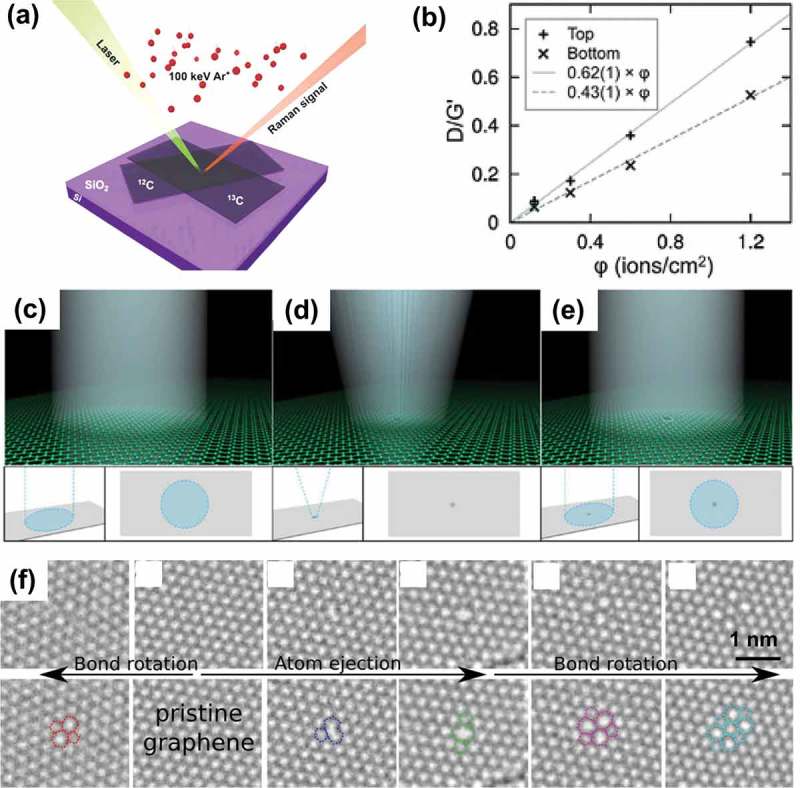
(a) Schematic illustration of the experimental setup for the irradiation of Ar+ ions with various doses followed by Raman probing [326]. (b) D/G’ intensity ratios as functions of Ar+ ion irradiation fluence (in 1013 ions/cm2) [326]. Schematics of the beam profile used in the three principle stages [328]: (c) a broad beam used to image graphene before defect formation, (d) a focused beam with a high current density used to form defects and (e) a broad beam used to image graphene after defect formation. (f) Creation of the defects can be explained by atom ejection and reorganization of bonds via bondrotation [339] (reused with permissions from [326] Copyright © 2012, John Wiley and Sons, [328] Copyright © 2012, Springer Nature, and [339] Copyright © 2011 American Physical Society).
