
Figure 19.
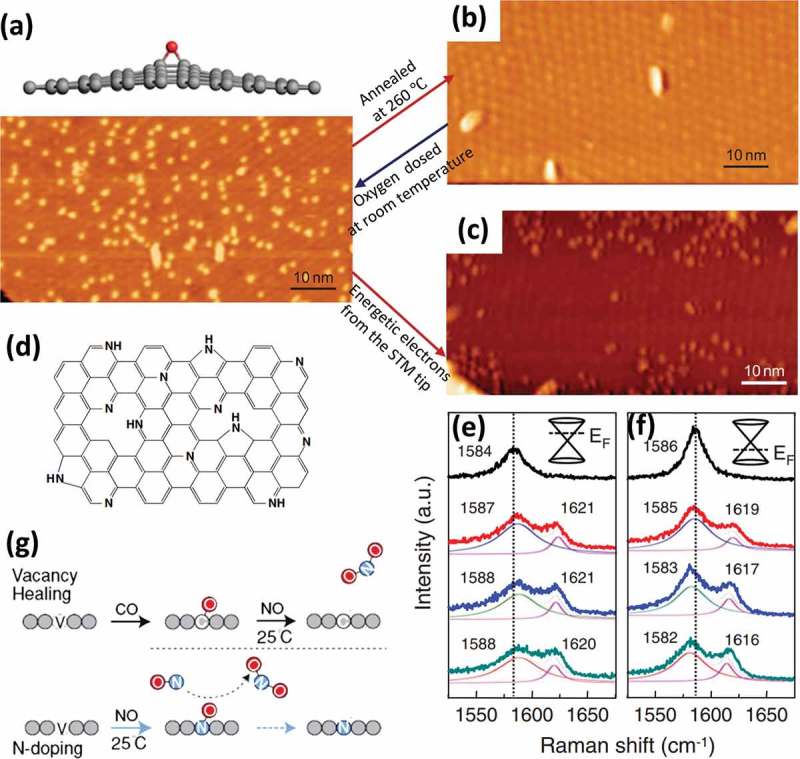
(a) Configuration of chemisorbed oxygen on graphene sheet, which corresponds to bright protrusions in bottom Auger electron spectroscopy (AES) image [345]. STM images of UHV oxidized epitaxial graphene after (b) annealing at 260 °C and (c) reversibly desorbed by injecting electrons from the STM tip at a sample bias of + 4V and tunneling current of 1 nA [345]. (d) Schematic of postulated nitrogenation on graphene [346]. The evolution of G peak upon plasma exposure for graphene with initial Fermi level lying in (e) conduction band and (f) valance band, respectively. The dashed lines indicate the G peak position of pristine graphene [346]. (g) Schematic view of the vacancy healing and N-doping processes of graphene by chemical reactions [331] (reused with permissions from [345] Copyright © 2012, Springer Nature, [346], Rights managed by AIP Publishing, and [331] Copyright ©2011 American Physical Society.).