. 2018 May 14;7(5):888–896. doi: 10.1039/c7tx00307b

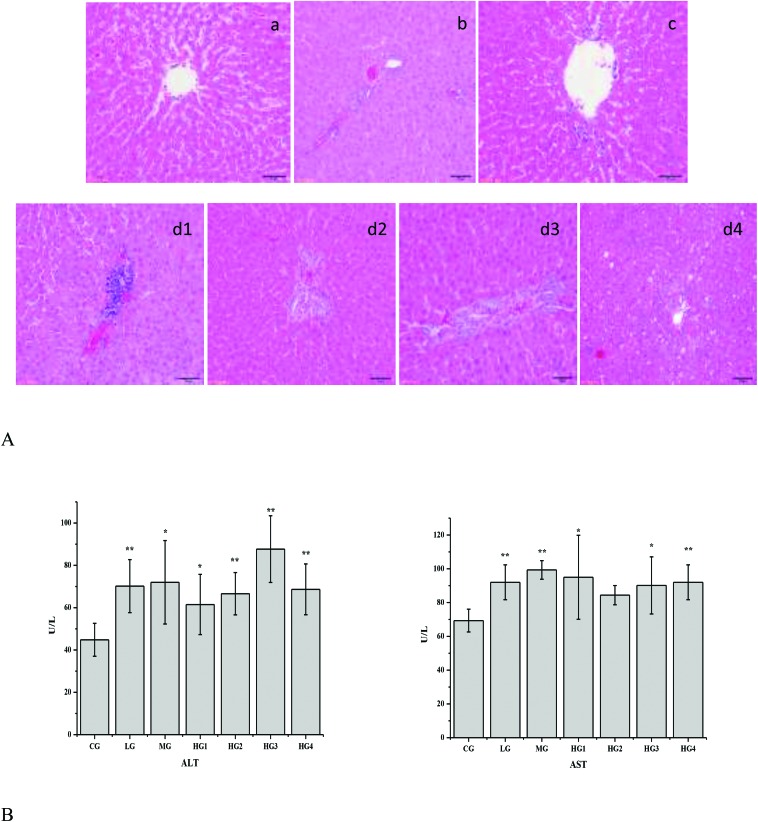
Fig. 1. Metabolic changes of different doses of emodin in the rat liver. A, Histological confirmation of the liver. Sections of the liver tissues were stained with hematoxylin–eosin and were examined by pathologists. a, control group; b, low dose group; c, middle dose group; d1, high dose in 1-week group; d2, high dose in 2-week group; d3, high dose in 3-week group; d4, high dose in 4-week group. B, Blood ALT and AST levels. The results are plotted as the mean ± standard error (n = 3). Comparisons with the CG, LG, MG, HG1, HG2, HG3 and HG4 were performed, and the results were analyzed by a one-way analysis of variance. * for P value <0.05, **for P value <0.01.

Fig. 1