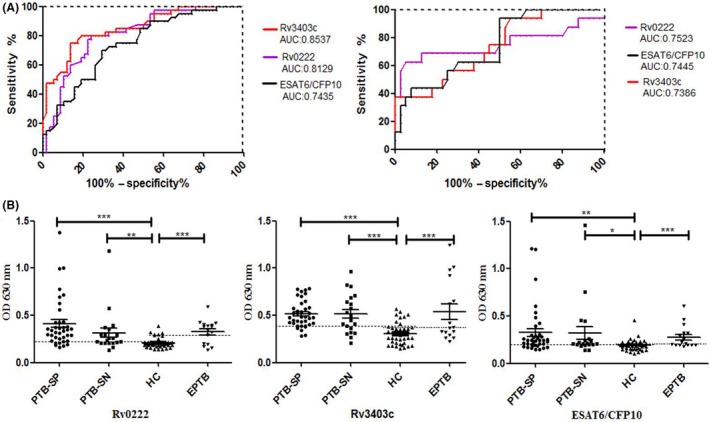
Figure 2.

Levels of antibodies among different groups of PTB patients, EPTB patients and HC. A. ROC curve analysis of Rv3403c and Rv0222 performance using ESAT6/CFP10 as the positive control for serodiagnosis of PTB patients and HC control (left) or EPTB and HC control (right) was performed. B. Each point represents one serum sample. The horizontal solid lines on each group indicate the median value. Dotted lines on each group indicate the cut‐off value. The optimal cut‐off value representing maximum sensitivity and specificity (minimal false negative and positive rates) is determined by ROC curve analysis for serodiagnosis of PTB (EPTB) patients and HC. OD630 represents the optical density at a wavelength of 630 nm. The P values of the OD 630 difference between each two groups were shown above the plots determined with one‐way ANOVA Newman‐Keels test. ***, P < 0.001; **, P < 0.01; *, P < 0.05.
