Figure.

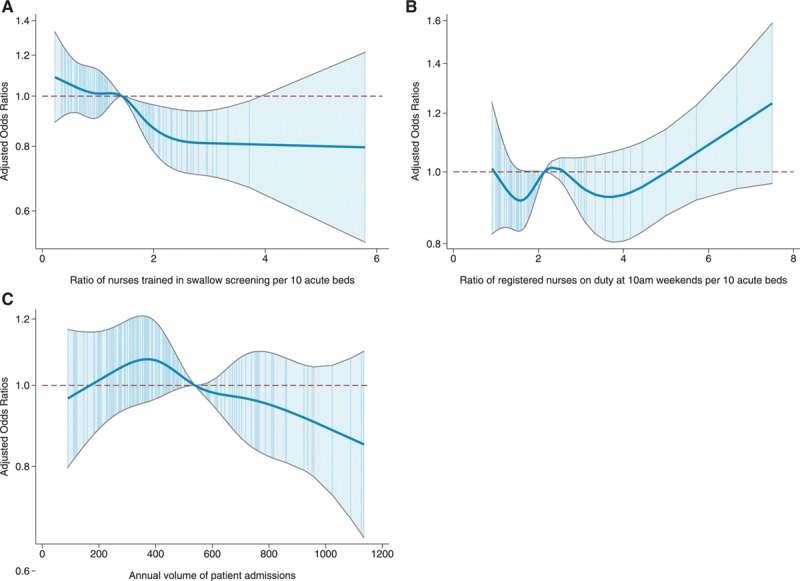
Spline diagrams for hospital-level organizational characteristics in the final model; for the ratio of nurses trained in swallow screening (A), the ratio of registered nurses on duty at 10 am weekends (B), and the annual volume of patient admissions (C). Adjusted odds ratios and 95% CIs where the reference value for each covariate is the median.
