. 2018 Jun 19;7(5):959–969. doi: 10.1039/c8tx00112j

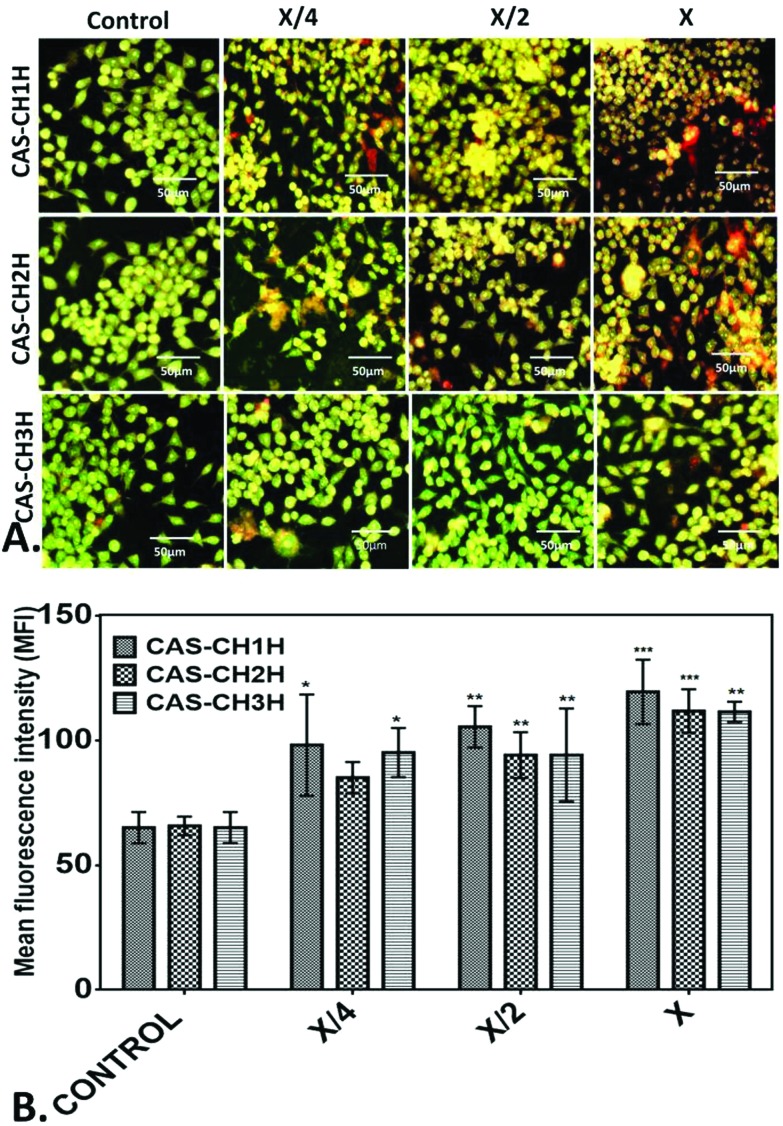
Fig. 6. Apotosis analysis of RAW 264.7 cells treated with different concentration of CAS–CH nanohybrid synthesized by HEBM at different milling times. The cells were stained with Acridine orange(AO)/EtBr after treatment with nanohybrids. (A) Fluorescent image of the stained cells. (B) Mean fluorescent intensity of the fluorescence of AO/EtBr stained cells. The images were analysed with help from Image J. All experiments were done in triplicate and data is presented as mean ± SD of three independent experiments. Statistical analyses were performed using GraphPad Prism v6.01 (San Diego, California). The data was subjected to two-way ANOVA with level of significance set at P < 0.05. Differences between groups were analyzed by Tukey's HSD test for multiple comparisons. *P < 0.05 denotes significant change from control and number of * represents the degree of significance.

Fig. 6