. 2018 May 11;7(5):859–873. doi: 10.1039/c8tx00045j

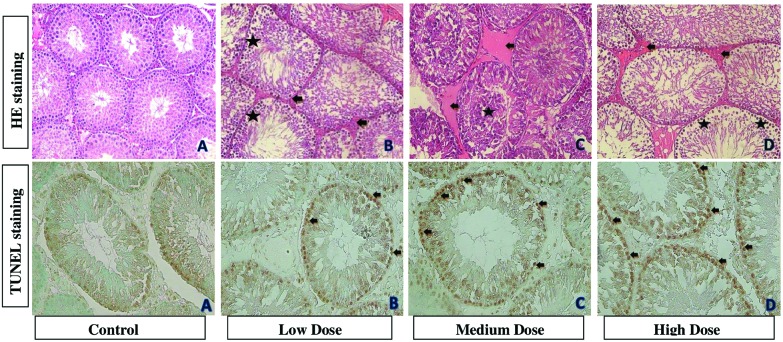
Fig. 5. Photomicrographs showing testis tissues of control and treatment groups. (A) is from the control group. (B) is from the 100 mg kg–1 per day DEHP treatment group and it shows congestion (black arrow) and pycnotic nucleus (asterisk). (C) is from the 200 mg kg–1 per day DEHP treatment group and it shows congestion (black arrow) and cells in the lumen (asterisk). (D) is from the 400 mg kg–1 per day DEHP and it shows pycnotic nucleus (asterisk) and congestion (black arrow) (all were stained with contrast by H&E, ×200). In TUNEL staining, (A) is from the control group. (B) is the 100 mg kg–1 per day of DEHP, (C) is the 200 mg kg–1 per day of DEHP and (D) is the 400 mg kg–1 per day of DEHP. Black arrows show apoptotic cells in testes (×400).

Fig. 5