. 2018 May 11;7(5):859–873. doi: 10.1039/c8tx00045j

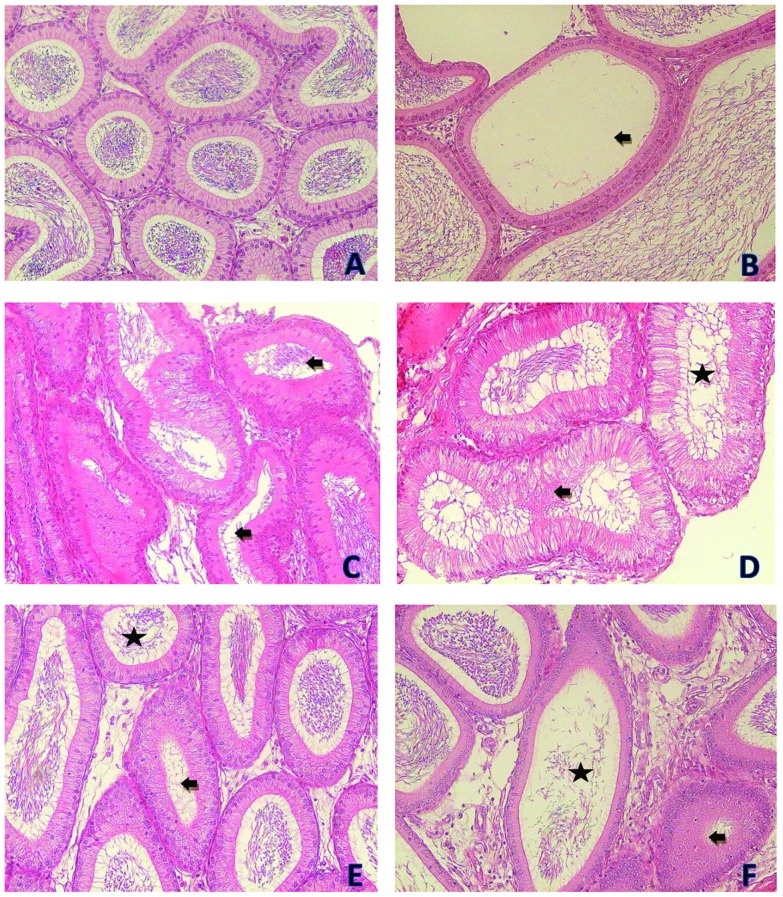
Fig. 6. Photomicrographs showing the epididymis tissues of the control and treatment groups. (A) is from the control group. (B) is from the 100 mg kg–1 per day DEHP treatment group and it shows tubules without sperm (black arrow). (C) is from the 200 mg kg–1 per day DEHP treatment group and it shows tight lumens of tubules (black arrow). (D) is from the 200 mg kg–1 per day DEHP treatment group and it shows atrophic tubules (black arrow) and less sperm in the lumen (asterisk). (E) is from the 400 mg kg–1 per day DEHP treatment group and it shows tight lumen of tubules (black arrow) and less sperm in the tubule (asterisk). (F) is from the 400 mg kg–1 per day DEHP treatment group and it shows atrophic tubules (black arrow) and less sperm in the tubule (asterisk) and there is a decrease in the tubule epithelial length (all were stained with contrast by H&E, ×200).

Fig. 6