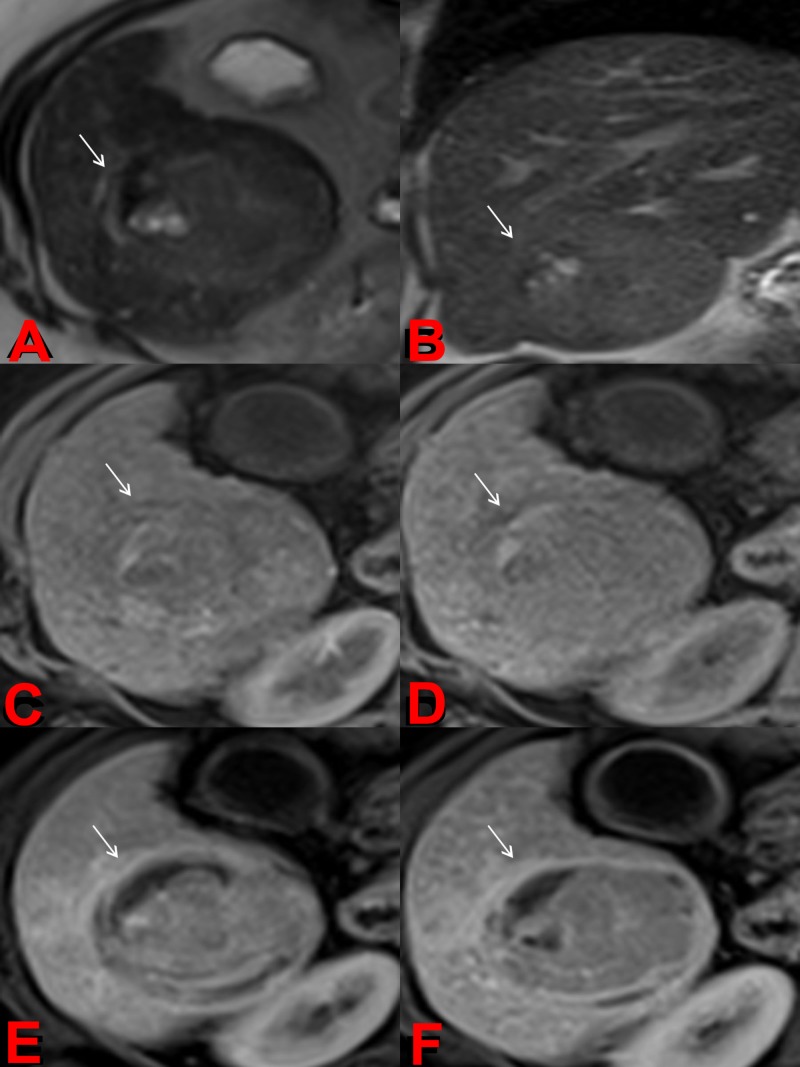
Figure 4. Post-treatment Magnetic Resonance Imaging (MRI).
Axial (a) and coronal (b) T2-weighted images demonstrate an overall decrease in signal intensity of treated HCC with interval development of hyperintense foci compatible with cystic necrosis. Precontrast (c), arteral (d), portalvenous (e), and delayed (f) postcontrast T1-weighted images demonstrate lack of tumor enhancement compatible with nonviable tumor and necrosis.

