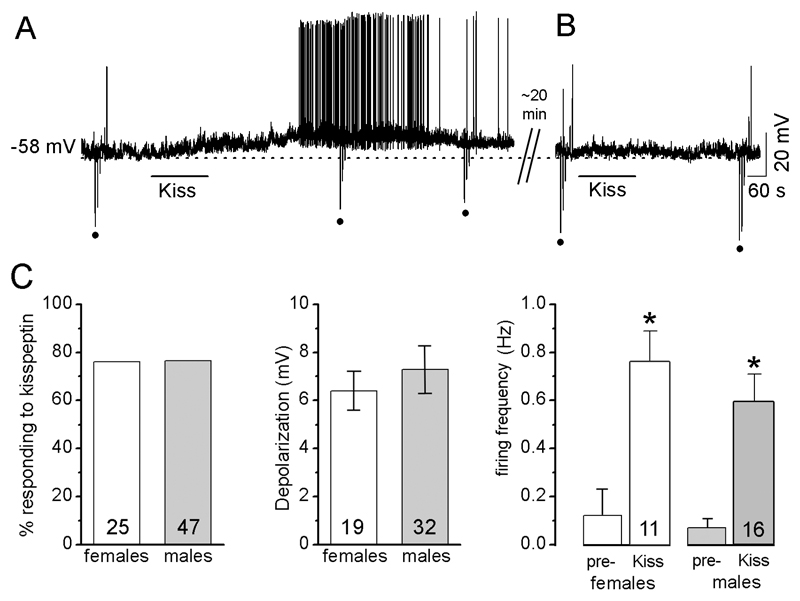
Figure 1. Kisspeptin depolarizes GnRH neurons.
Note: for all figures, the upward and downward deflections (dots) from the voltage traces are responses to the injection of hyperpolarizing or depolarizing currents to test membrane resistance. Drug applications are indicated by the horizontal line above or under traces. A, Representative voltage trace showing kisspeptin depolarization of a GnRH neuron with a decrease in Rin. Note, responses to current injections (dots) are smaller during kisspeptin than those during control. B, the same cell approximately 40 min after the initial kisspeptin test does not respond to a second kisspeptin application. C, Histograms showing no differences between diestrous females and males in the % of GnRH neurons that respond to kisspeptin, the degree of depolarization evoked by kisspeptin or the increase in firing frequency evoked by kisspeptin. Pre-= firing rate before kisspeptin. Kiss = firing rate during kisspeptin application * p<0.001 compared with “pre-“, paired-Student-t test. The N numbers are given at the base of each histogram.

