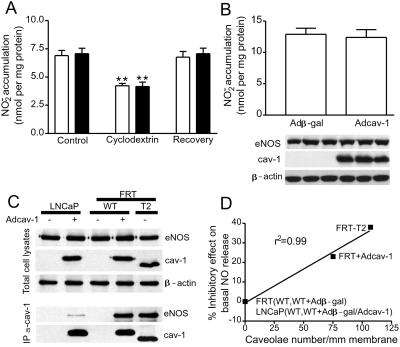
Figure 4.
Cav-1 per se does not influence NO release, but cav-1 in closer proximity to eNOS in caveolae interacts with eNOS and inhibits NO release. In A, the production of NO (assayed as NO2−) in response to calcium ionophore (1 μM) was examined in LNCaP cells expressing β-gal (open bars) or Adcav-1 (filled bars). Cells were treated or not with CD and CD plus cholesterol as mentioned previously, and calcium ionophore was added for 15 min. NO2− was quantified in the media. The accumulation of NO2− from LNCaP cells not expressing eNOS was subtracted as a background. In B, the basal accumulation of NO2− in LNCaP cells infected with Adβ-gal or Adcav-1 and AdeNOS was assessed. The graph shows accumulated NO2− normalized per mg of protein (mean ± SEM, n = 3 experiments in triplicate; **, P < 0.01). Inset below shows the level of expression of eNOS and cav-1 determined by Western blot in cells from which NO release was determined in one representative experiment performed in triplicate. Equal protein loading is confirmed by β-actin. In C, cav-1 and eNOS were expressed in LNCaP or FRT cells (Top reflects expression of protein in lysates), and cav-1 was immunoprecipitated from cells and the relative amount of associated eNOS determined by Western blotting (Bottom). Note that equal amounts of eNOS and cav-1 were recovered from cell lysates; however, the amount of cav-1-associated eNOS was markedly less in cells that cannot form caveolae. The different molecular mass of cav-1 introduced by Ad is the result of an myc tag on the carboxyl tail. In D, the percent inhibition of NO2− accumulation from parental FRT and LNCaP cells, T2 cells, and Adcav-1-transduced cells is plotted against the number of caveolae in these cells (see Table 1 for details). Data were correlated (r2 = 0.99) by first-order linear regression with GraphPad (San Diego) PRISM software.

