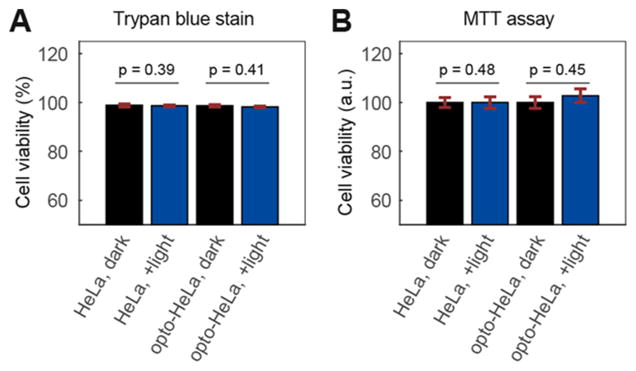
Figure 4.

Cell viability assays for optoTGFBRs-HeLa cells after 24 h of blue light illumination (488 nm, 0.8 mW/cm2). (A) Trypan blue stain assay, (B) MTT cell viability assay. Error bars in A and B show the standard errors of the mean from 6 and 16 replicates, respectively. The p-values were calculated using a two-sample t test.
