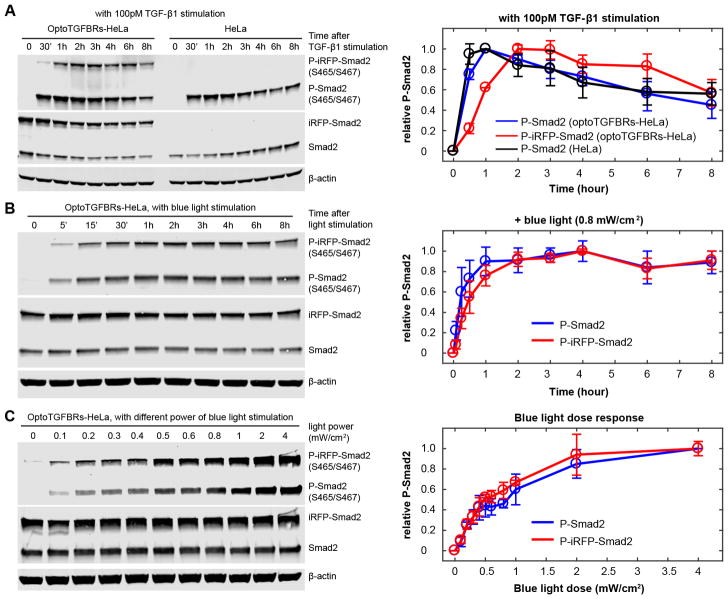
Figure 5.
Smad2 phosphorylation responses in optoTGFBRs-HeLa cells. (A) Time course of P-Smad2 response to 100 pM TGF-β1 ligand stimulation. (B) Time course of P-Smad2 response to continuous blue light illumination (488 nm, 0.8 mW/cm2). (C) P-Smad2 response at 45 min after different power of blue light stimulations. Relative P-Smad2 level was quantified as the ratio of P-Smad2 to corresponding Smad2 signal (normalized with the maximal signal in each time course). Error bars show the standard deviations from three replicates.

