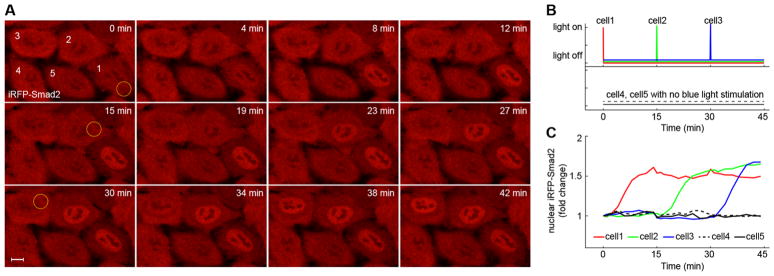
Figure 6.
Spatiotemporal control of Smad2 signaling in optoTGFBRs-HeLa cells. (A) One short pulse of blue light (488 nm, 12.4 μW with pixel dwell time, 100 μs) was used to illuminate the yellow circle area of cell 1, cell 2, cell 3 at 0 min, 15 and 30 min, respectively. Representative fluorescent images of iRFP-Smad2 from optoTGFBRs-HeLa cells show selective and sequential nuclear Smad2 accumulation in different cells. (B) Schematic representation of the light stimulation for the marked cells in panel A. (C) Quantification of nuclear Smad2 signaling dynamics of the marked cells in panel A. See also Movie S1. Scale bar: 10 μm.

