Fig. 2.

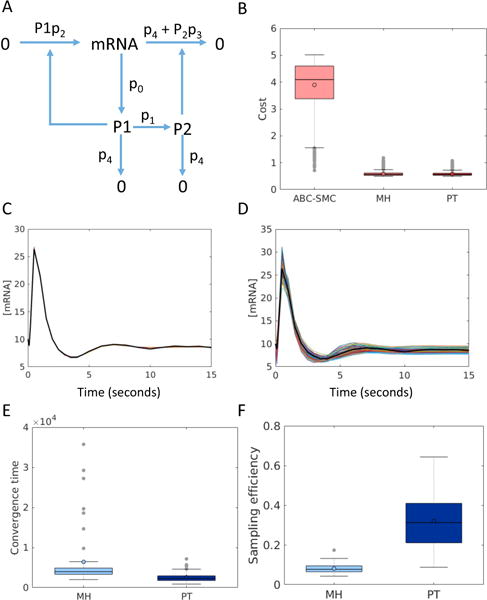
Parameter estimation for the model of mRNA self regulation. (A) Reaction network diagram of the mRNA self regulation model from [22] (B) Quality of fit of the final ensemble obtained from ABC-SysBio, PT and MH. The box plots show the distribution of the Euclidean distances of the 100 members of each of 50 fitted ensembles from the synthetic data. Example of a typical fitted ensemble obtained from (C) PT and (D) ABC-SysBio. Black lines show the synthetic data, and the colored lines show the fitted trajectories. [mRNA] refers to the number of mRNA molecules. (E) Distribution of convergence times for PT vs. MH with an energy threshold of 20. PT takes on average ~2-fold fewer steps to reach convergence. (F) Comparison of sampling efficiency of MH vs. PT.
