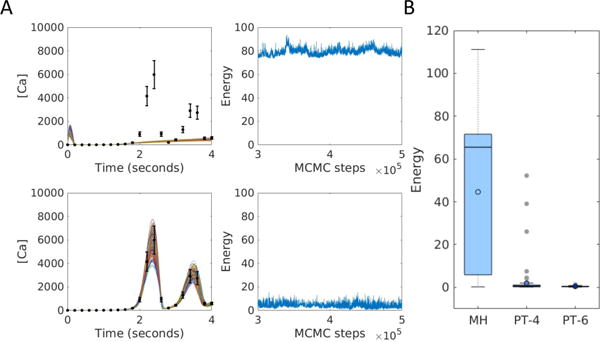
Fig. 4.

Parameter estimation for the model of calcium signaling. (A) Examples of convergence to a local minimum (top) and to the global minimum (bottom). Error bars show synthetic data. Solid lines show the simulated fits. The right column shows the energy chains corresponding to the fits on the left. (B) Distributions of the minimum energy from MH, PT-4 and PT-6 over 100 repeats.
