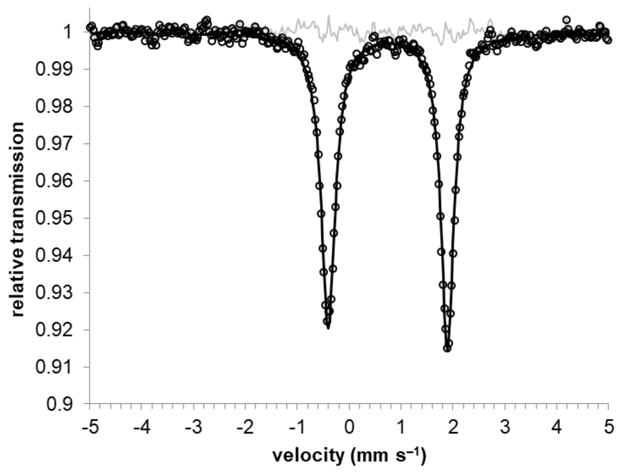
Figure 2.

Zero-field Mössbauer spectrum of a solid sample of 3-Na at 80 K. The black circles are the data, the black line is a fit with two Lorentzians of equal intensity but slightly different line widths (γL = 0.328 and γR 0.304); the thin grey line is the residual from the fit.
