Figure 4.

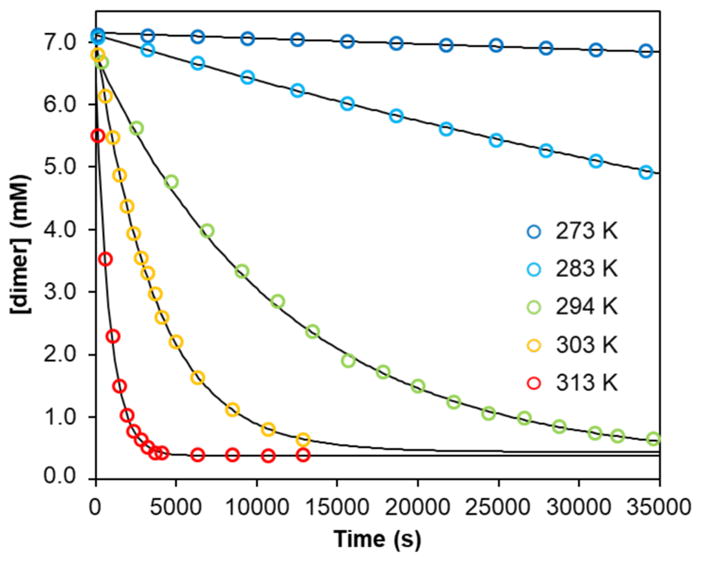
Concentration of dimer 3-Na vs time in THF solution at various temperatures. Open circles are data points and solid lines are fitted curves. Log plots of the data are in the Supporting Information (Fig. S11–S16).

Concentration of dimer 3-Na vs time in THF solution at various temperatures. Open circles are data points and solid lines are fitted curves. Log plots of the data are in the Supporting Information (Fig. S11–S16).