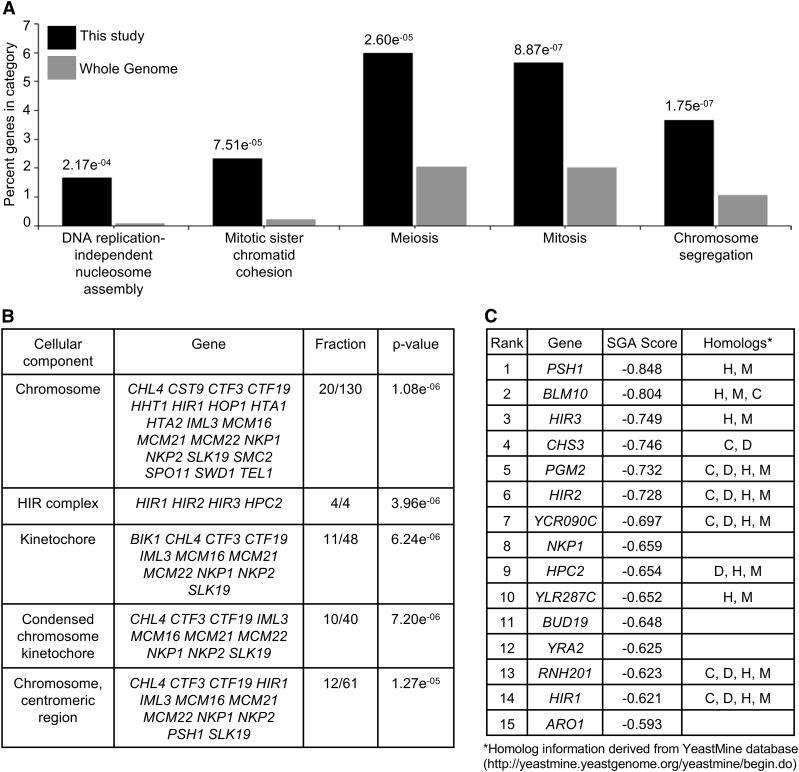
Figure 1.
Gene ontology (GO) analysis of negative genetic interactors identified in the SGA screen with GALCSE4. (A and B) GO analysis for biological processes (A) or cellular components (B) for the 301 significant negative genetic interactors using the FunSpec bioinformatics tool (http://funspec.med.utoronto.ca/, April 2017). Analysis was performed using a P-value cutoff score of 0.01 and results with a P-value <2.0e−04 are displayed. The P-value represents the likelihood of candidate genes from the screen intersecting with the specified category. The percentage denotes the number of genes found in a given category over the number of input genes. The fraction denotes the number of candidate genes over the number of genes annotated within the category. The GO annotation representing genes associated with a particular cellular component or biological process are described. (C) List of the top 15 negative genetic interactors identified in the SGA screen with GALCSE4. Listed are the gene name, SGA score and homologs denoted as H, human; M, mouse; D, Drosophila melanogaster; C, Caenorhabditis elegans. The SGA score is the epsilon value calculated as previously described (Costanzo et al. 2010, 2016).

