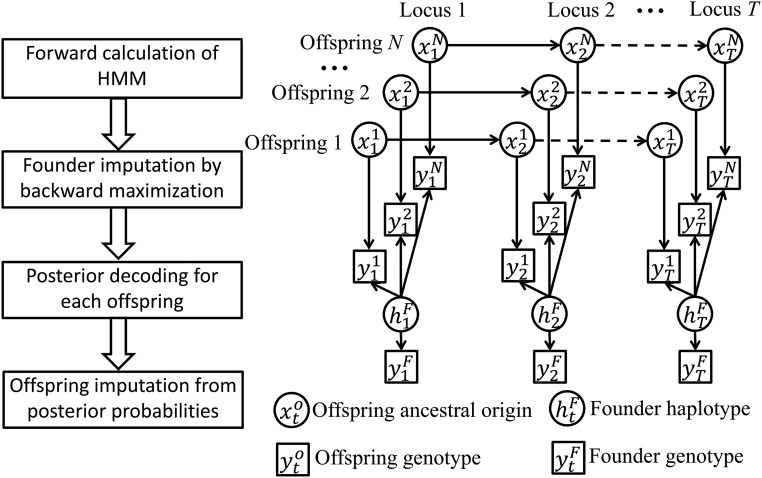
Figure 1.
Overview of the imputation algorithm. The left panel shows the diagram of magicImpute. The right panel shows the directed acyclic graph of the HMM for N offspring at T loci, where the arrows denote probabilistic relationships that are described in the Methods section. See Table 1 for the symbols in the right panel. In the left panel, the second step of founder imputation results in the estimate of and the third step of posterior decoding results in the posterior probability of conditional on genotypic data and for and

