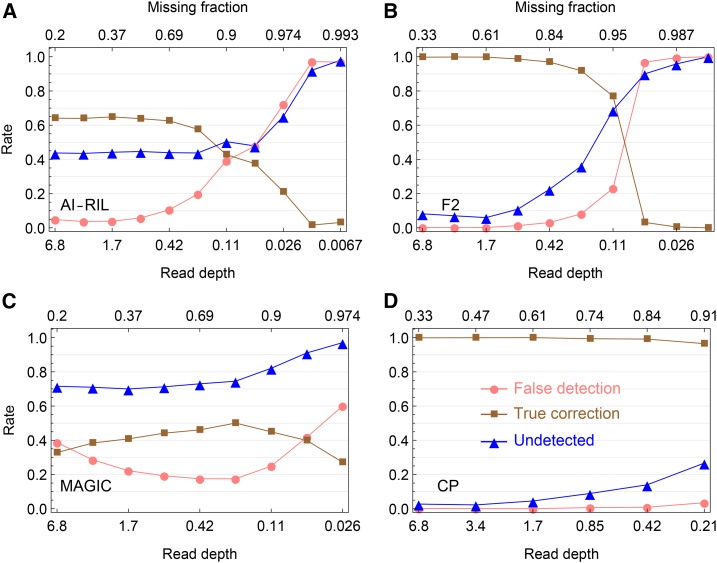
Figure 3.
Simulation evaluation on the error detection in offspring genotypes. (A–D) Shown are the results for the AI-RIL, the F2, the MAGIC, and the CP, respectively, which are obtained by magicImpute with the first two founders’ genotypes being unavailable and the input data being called genotypes. The false detection rate (●) denotes the percentage of estimated suspicious genotype errors being not true errors, the true correction rate (▪) denotes the percentage of estimated suspicious genotype errors being true and being corrected into the true genotypes, and the undetected rate (▴) denotes the percentage of true genotype errors being undetected.

