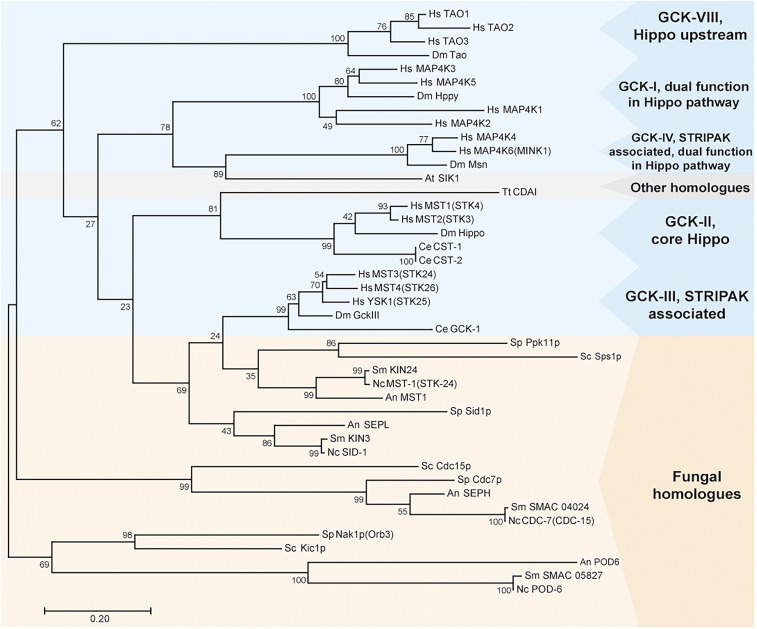
Figure 1.
Phylogenetic analysis of GCKs from animals (blue box), fungi (orange box), and plants and protozoans (gray box). Amino acid sequences were taken from the National Center for Biotechnology Information database. The phylogenetic tree was built using the maximum likelihood method based on the sequence alignment of conserved serine/threonine kinase domains from GCKs. The percentage of trees is given in which the associated taxa clustered together next to the branches (n = 1000). An, A. nidulans; At, Arabidopsis thaliana; Dm, D. melanogaster; GCK, germinal center kinase; Hs, Homo sapiens; Nc, N. crassa; Sc, Sa. cerevisiae; Sm, Sordaria macrospora; Sp, Sc. pombe; STRIPAK, striatin-interacting phosphatases and kinases; Tt, Tetrahymena thermophila.

