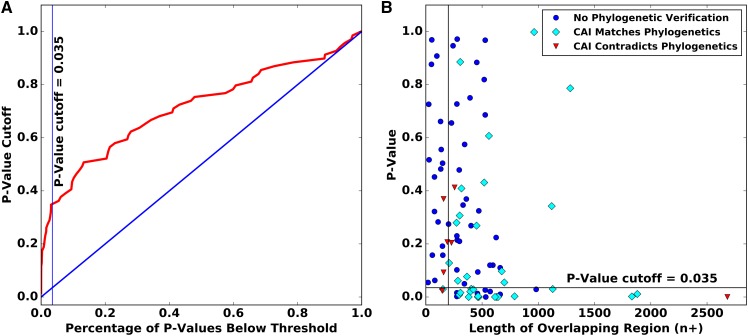
Figure 2.
Statistical classification of relative ages. (A) The receiver operating characteristic plot for determining which member of an overlapping gene pair has higher CAI, and is hence presumed to be ancestral. Only genes with an overlapping region of at least 200 nucleotides are plotted. (B) CAI classification of the 91 gene pairs for which codon usage data were available was based both on P-value and on the length of the overlapping regions. The vertical line shows the overlapping length cutoff of 200 nucleotides, the horizontal line shows the P-value cutoff; CAI classification was considered informative for the 27 bottom right points.

