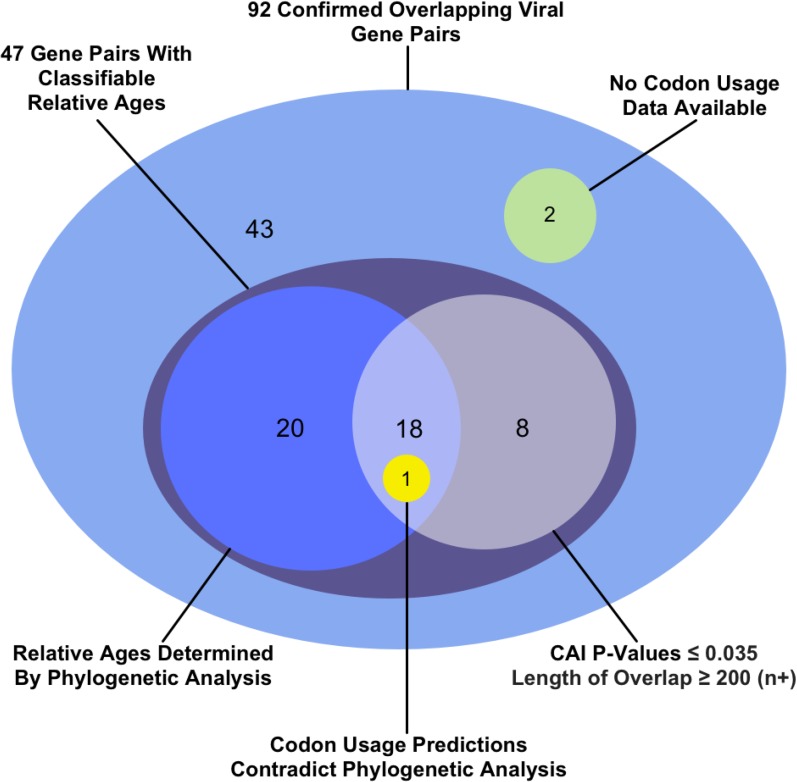
Figure 3.
How the relative ages of the genes were classified for 47 out of the 92 overlapping gene pairs for which sequence data were available. Within each shaded region, each gene pair is counted within only one of the subregions shown. Each shaded region’s total is found by summing the individual subtotals within it, some of which are noted outside the shaded regions. For example, the relative ages of 39 genes were classified via phylogenetic analysis: 20 through phylogenetic analysis alone (blue circle), 18 supported via codon analysis (intersection of blue and white circle), and one contradicted by codon analysis (yellow circle).

