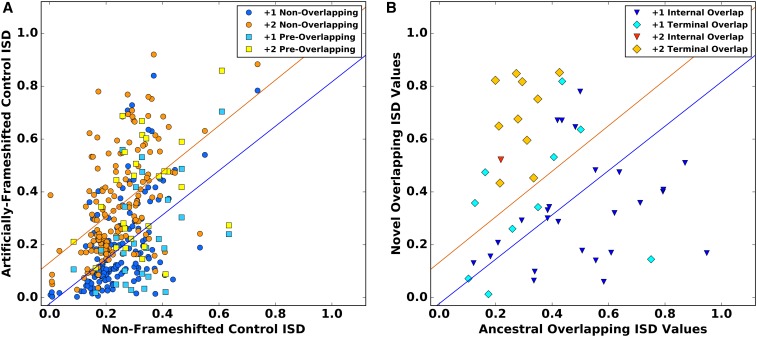
Figure 5.
(A) The ISD of a nonoverlapping gene predicts the ISD of the non-ORF frameshifted version of that sequence. Model I regression lines are statistically indistiguishable in our set of 150 nonoverlapping viral genes vs. our set of 27 preoverlapping genes, which are therefore pooled ( and for the +1 and +2 groups, respectively). (B) The overlapping ISD of the 47 gene pairs with classifiable relative ages. Each datapoint represents one overlapping pair. The regression lines from (A) are superimposed to illustrate the elevation of novel gene ISD born into the already intrinsically high-ISD +2 frame, which destroys the correlation ( for +2 in contrast to 0.26 for +1).

