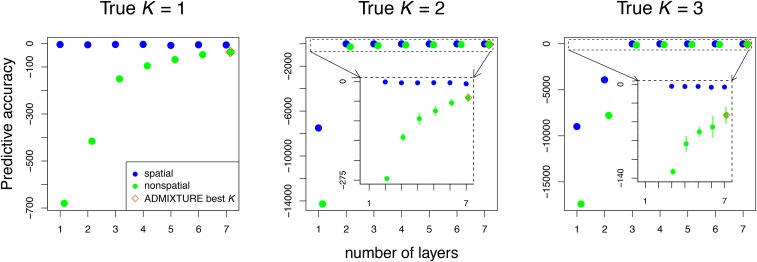
Figure 3.
Cross-validation results for data simulated under and comparing the spatial and nonspatial conStruct models (in blue and green, respectively) run with through 7, with 10 cross-validation replicates. The inset plots zoom in on cross-validation results outlined in the dotted boxes. The spatial model shows better model fit at every value of K. The vermillion diamond indicates the value of K selected on the basis of lowest cross-validation error among ADMIXTURE models. In all simulations, the preferred ADMIXTURE model was that with the largest number of clusters.

