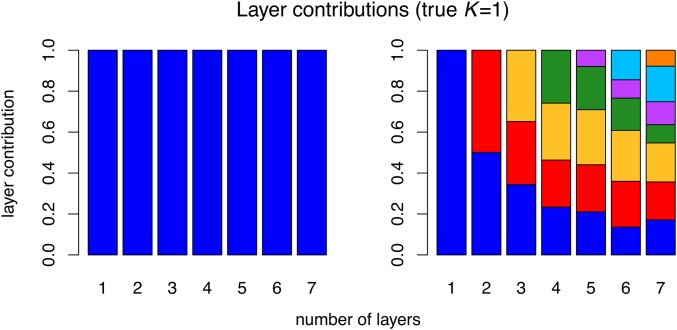
Figure 4.
Results for data simulated using showing layer/cluster contributions (i.e., how much each layer/cluster contributes to total covariance), from conStruct runs using through 7 for the spatial model (left), and the nonspatial model (right). In each run of the spatial model, a single layer explained nearly all the covariance (additional bars are present but not visible).

