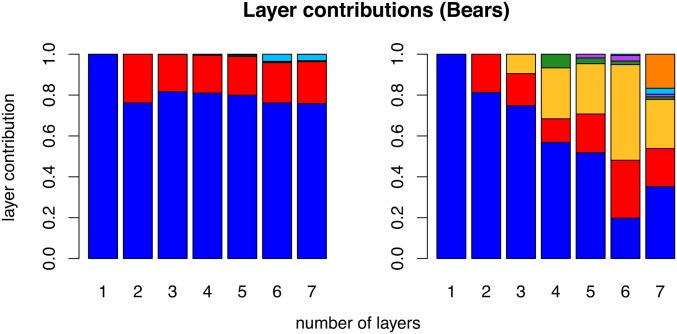
Figure 9.
Layer/cluster contributions (i.e., how much total covariance is contributed by each layer/cluster), for all layers estimated in runs using through 7 for the spatial model (left), and for all clusters using the nonspatial conStruct model (right). For each value of K along the x-axis, there are an equal number of contributions plotted. Colors are consistent with Figure 7.

