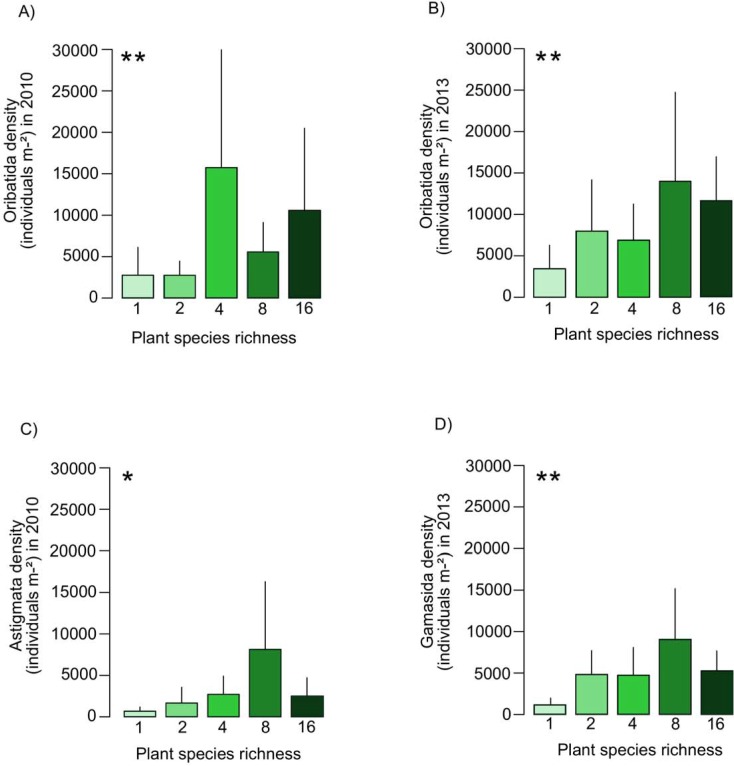
Fig 5. Effects of plant species richness on the density of Oribatida, Astigmata and Gamasida.
Variation in density of (A) Oribatida in November 2010, (B) Oribatida in October 2013 (three months after the flood), (C) Astigmata in November 2010, and (D) Gamasida in October 2013 with plant species richness (1, 2, 4, 8, 16 with 14, 16, 16, 16 and 14 replicates, respectively). Values are means ± SE. For statistical analysis see Table 5.

