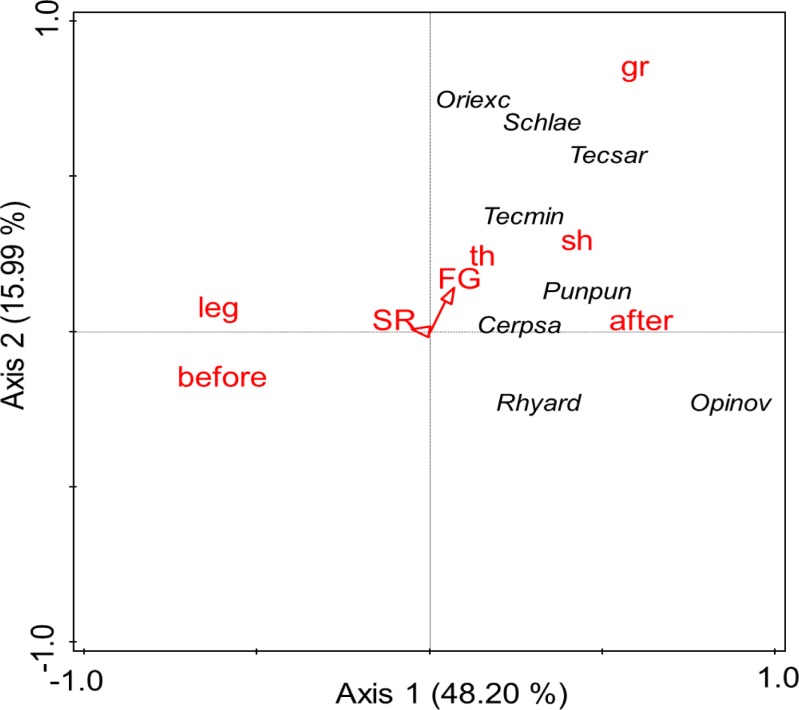
Fig 6. PCA of Oribatida species.
Principal components analysis (PCA) of Oribatida species in plant communities in November 2010 (before the flood) and October 2013 (three months after flood). Arrows indicate variations with plant species (SR) and plant functional group richness (FG). Variations with the presence of grasses (gr), legumes (leg), small (sh) and tall herbs (th) and between November 2010 (before) and October 2013 (after) are indicated by red triangles. For full species names see S2 Table.

