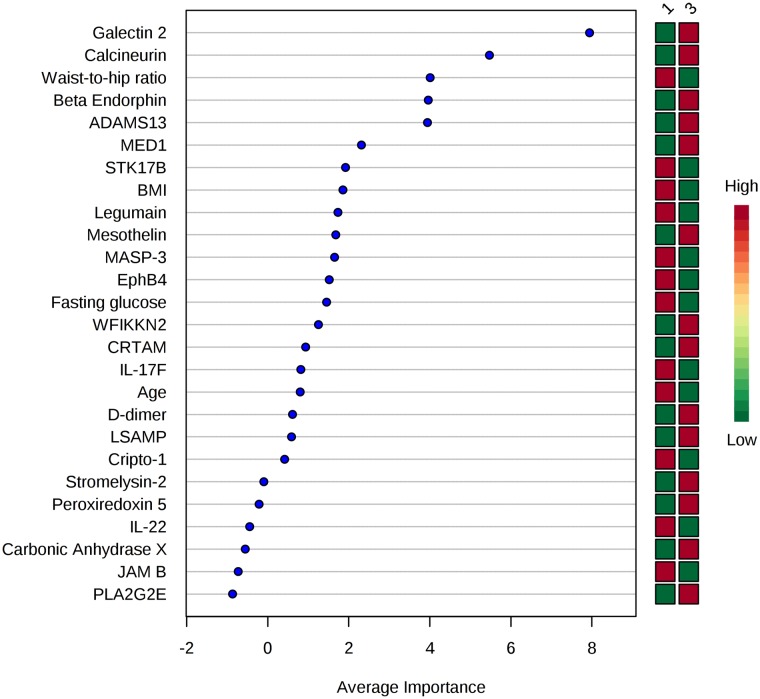
Fig 2. Features ranked by mean importance measure for the ROC curve analysis for beta-cell function/HOMA-IR.
Determination of the predictive ability of the protein panel (22 proteins associated with beta-cell function/HOMA-IR (p ≤ 0.01)), age, BMI, waist to hip ratio and fasting glucose, for discrimination between low and high beta-cell function/HOMA-IR values of MECHE participants (n = 30). Par scaling was used and random forest classification method was selected. Using all 26 variables, the best ROC curve was produced with an AUC of 0.913. AUC: area under the curve. 1: Tertile 1- low beta-cell function 3: Tertile 3- high beta-cell function. Green filled square: Low concentration/value Red filled square: High concentration/value Green filled square/ Red filled square: Positive association with beta-cell function/HOMA-IR Red filled square/Green filled Square: Inverse association with beta-cell function/HOMA-IR.

