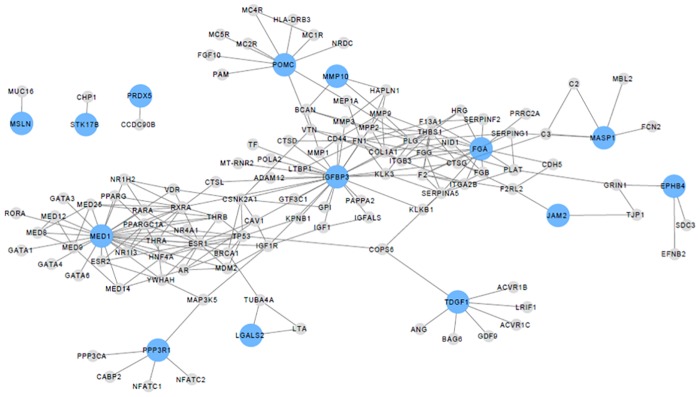
Fig 4. Network displaying proteins significantly associated with the disposition index and their direct interactions.
The nodes represent proteins and the edges represent protein-protein interactions. Proteins significantly related with the disposition index are in blue (p ≤ 0.01) and grey nodes are their direct interactions. 13/17 proteins significantly associated with the disposition index have direct interactions.

